"MAN": Simulation Example #2
Varying LTM Learning Rate
 This set of MAN simulations provides a very neat demonstration of
the ability of TUT to adapt to varying students' needs.
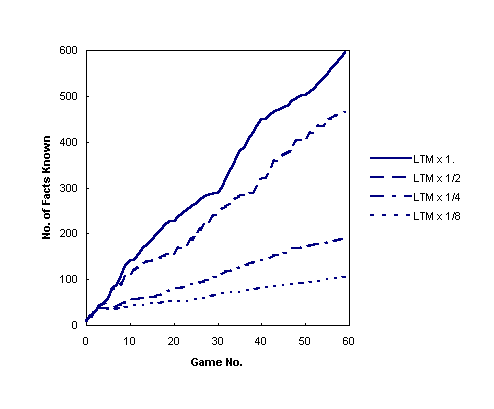
Starting from the "Super Student" (LTM x 1.), the LTM learning rate
is decreased by a factor of 1/2, yielding a set of four students
that range over a total factor of 8.
This set of MAN simulations provides a very neat demonstration of
the ability of TUT to adapt to varying students' needs.
Starting from the "Super Student" (LTM x 1.), the LTM learning rate
is decreased by a factor of 1/2, yielding a set of four students
that range over a total factor of 8.
For these four students, the Working Memory and all other characteristics
were held constant. This set of simulated students presents
TUT with the challenge of students that could learn everything in the
short term at the maximum rate, but that require increasing amounts of
repetition before a new fact is completely lodged in long term memory.
Another way of plotting this data is shown below. For the plot below,
just the endpoint of each of the student's learning curves is plotted
after 60 games.
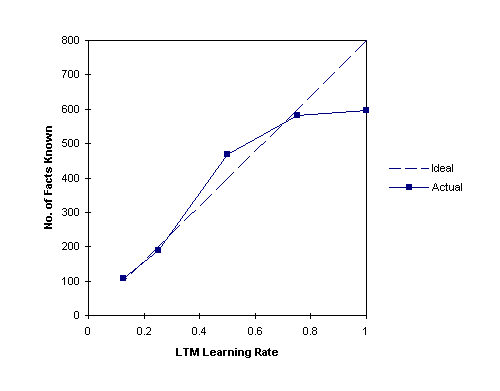
The dashed line labeled "ideal" is the result one would expect from the
variation of LTM learning rate that was assumed in the student modeling.
The solid curve shows the actual learning rate in the MAN simulations.
The ability of TUT to follow the student's learning rate is called
"adaptive tracking". The tracking accuracy in these simulations
is within 5-17% of ideal, except for the Super Student, where
TUT is still within 25%.
Continue to Next Example or Back to Previous
Example
Return to Phase I Results Page or ANSR
/ DOEd SBIR Project Page
Return to ANSR Home Page or Site
Contents -- or -- Contact ANSR.